Dashboards and Reports
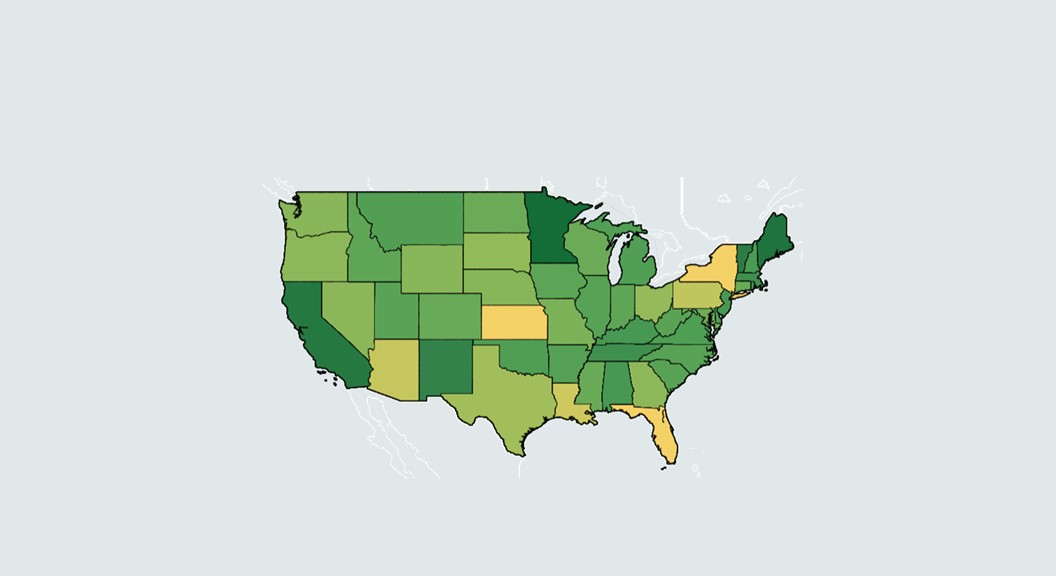
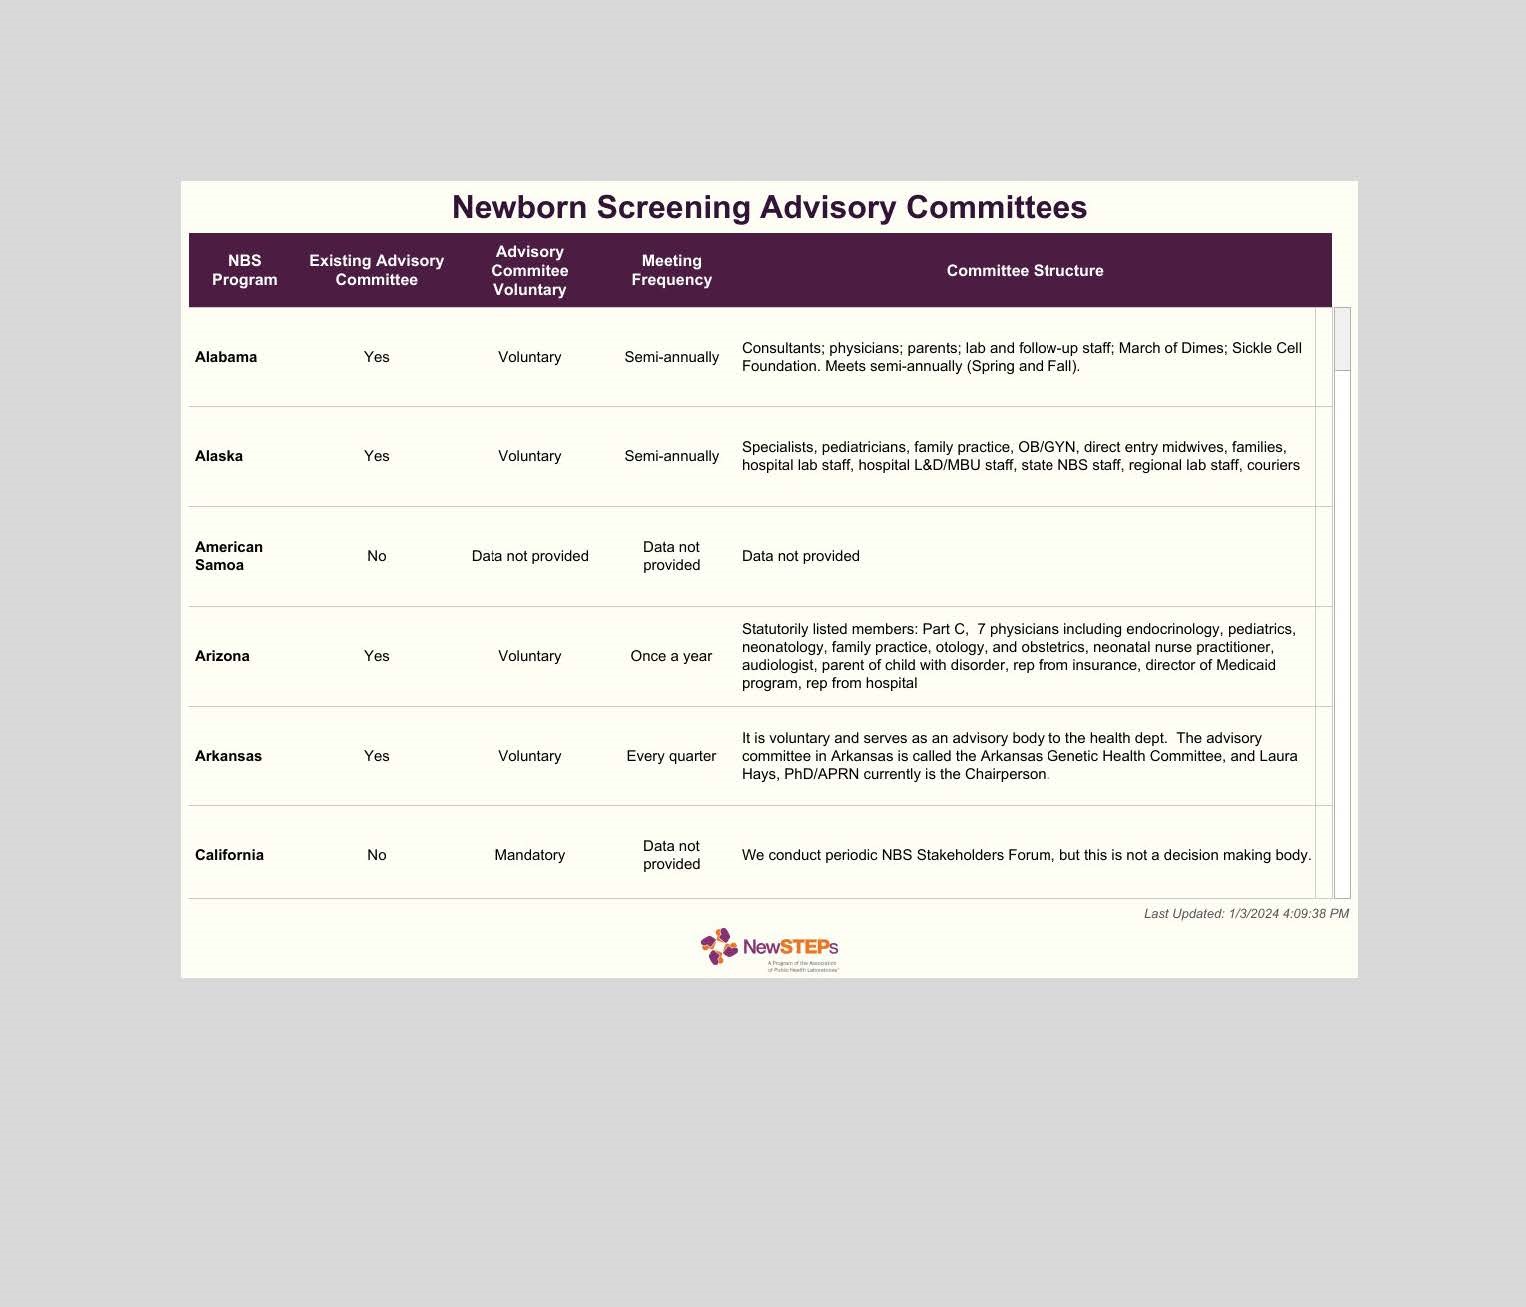
The interactive dashboards and reports utilize data entered into the NewSTEPs Repository. These reports and queries are updated each evening. Quality Indicator and Case Dashboards are only accessible for the user's assigned state and with the correct user role permission. Please contact newsteps@aphl.org if you are interested in obtaining an infographic user account, or if you have any questions or suggestions concerning any current or future data dashboards.